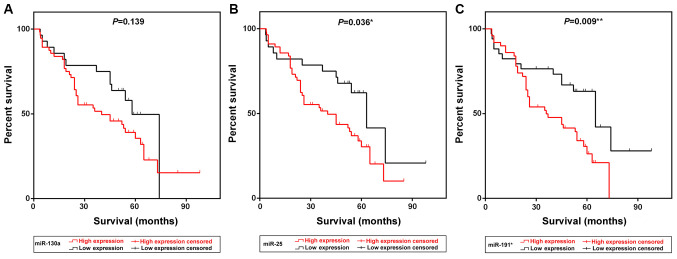
Figure 1.
Kaplan-Meier survival curves of patients with NSCLC grouped by miR-130a, miR-25 and miR-191* expression levels. (A-C) Kaplan-Meier curves indicating the survival of patients with NSCLC exhibiting low or high expression of (A) miR-130a, (B) miR-25 and (C) miR-191*. NSCLC, non-small cell lung cancer; miR, microRNA.

