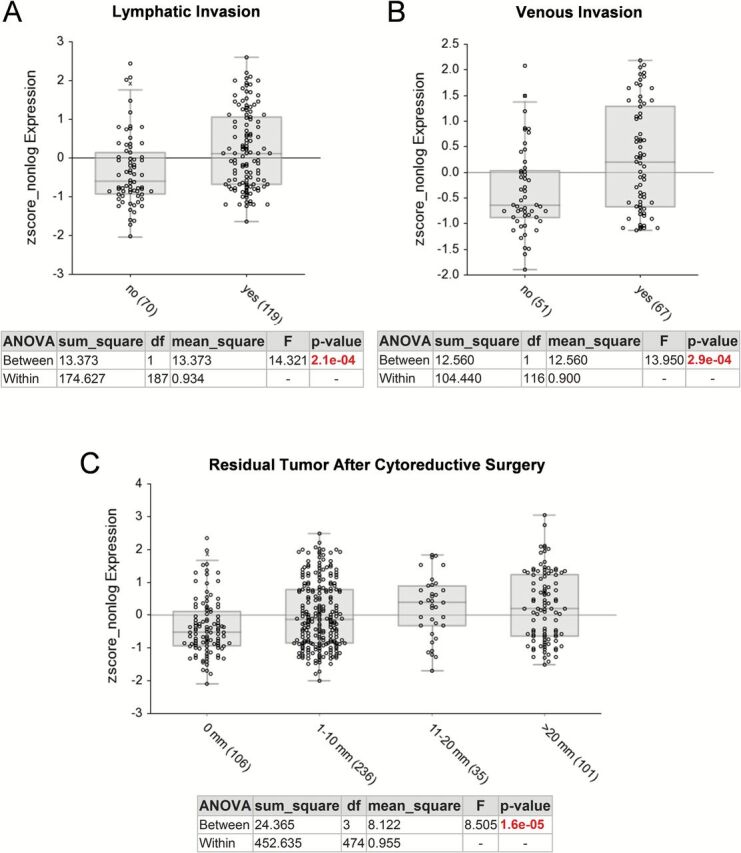
Figure 2.

Comparison of ADAM12 expression levels and clinicopathological parameters in the ovarian cancer TCGA data set. (A) Lymphatic invasion, (B) Venous invasion, (C) Residual tumor after cytoreductive surgery. The graphs and statistical data were generated using R2 Genomics Analysis and Visualization Platform. The x-axis shows individual groups where the number of patients in each group is indicated in parentheses. The y-axis represents a relative value of ADAM12 mRNA (202952_s_at) expression.
