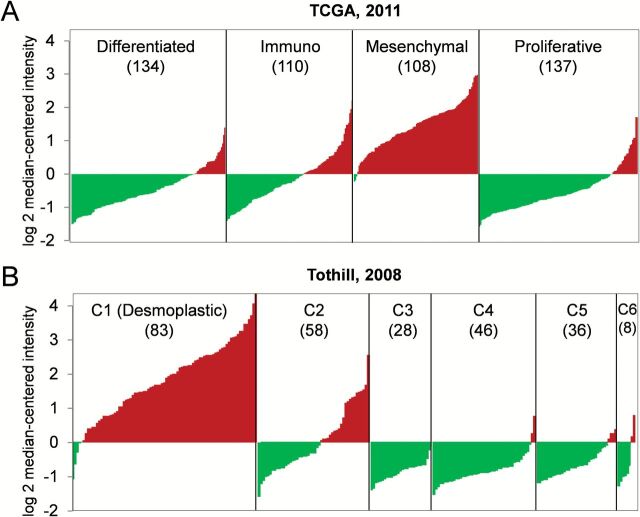
Figure 3.
Association of high expression levels of ADAM12 with a specific molecular subtype of ovarian carcinoma. A diagram of ADAM12 mRNA distribution in (A) 489 serous ovarian carcinomas in the ovarian cancer TCGA data set grouped into four distinct molecular subtypes and (B) 259 ovarian serous and endometrioid carcinomas in the Tothill data set grouped into six distinct molecular subtypes. The x-axis shows individual tumors that are merged into a continuous plot (the number of tumor samples in each subtype is indicated in parentheses). The y-axis represents a relative value of mRNA expression. Red indicates positive values, green indicates negative values.

