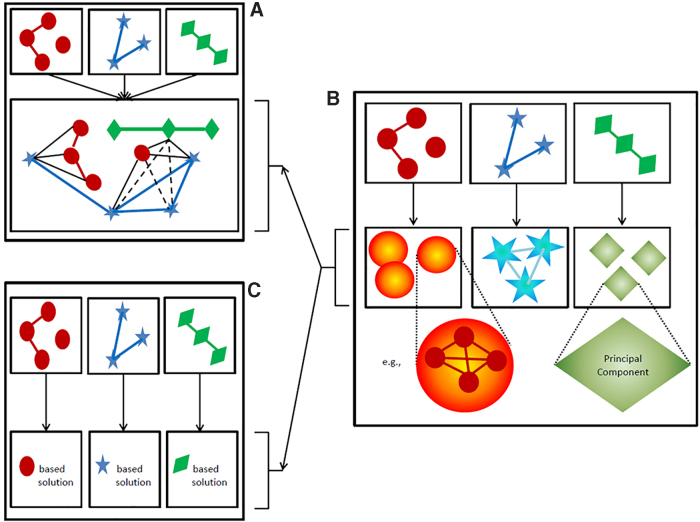
FIG. 2.
Traditional choices to handle different omics data sources before deriving an integrated solution. Different colors and symbols represent different data origins. (A) Data fusion, which allows accounting for structure between omics data. Evidence for such structural relationships may be derived from biological knowledge or analytically (full lines), or it may be deduced from the latter (dashed lines). (B) Changing the representation of each data source. This may be based on principles of dimensionality reduction or the identification of communities (cf. corresponding data corresponding symbols with gradient fill). (C) Obtaining a data-specific solution, hereby ignoring detailed inter-relationships between data sources as part of obtaining an integrative solution. Once data are represented as in (B), cross-data source relationships may be accounted for (A) or specific within-data source solutions may be targeted first (C), before obtaining an integrative solution. This is indicated by the arrows connecting panel B with, respectively (A, C).

