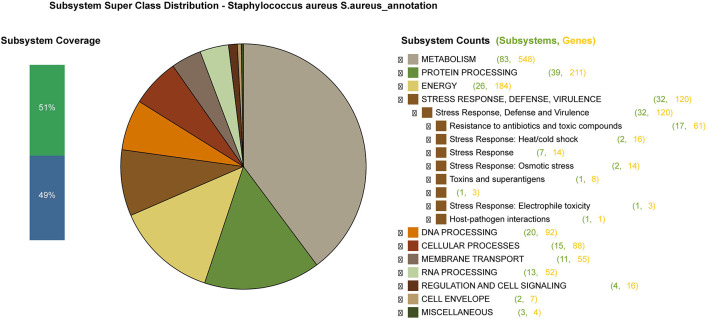
Figure 2.
An overview of the subsystem categories of the annotated draft whole-genome of S. aureus Sa1FB from the RAST server. The pie chart shows the counts of genes related to each subsystem. The bar graph (on the left) determines the subsystem coverage, this is the ratio of coding sequences annotated in the SEED subsystem (51%) and outside of the SEED subsystem (49%).

