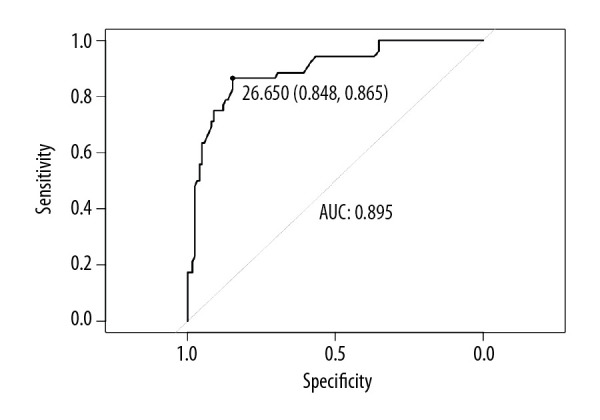
Figure 4.

ROC curve analysis predictive value of sST2 of LA LVZ. sST2=26.65 ng/mL; sensitivity=86.5%; specificity=84.8%; AUC=0.895; 95% CI=0.842–0.948, P<0.001. AUC – area under the curve; CI – confidence interval; ROC – receiver operating characteristic; sST2 – soluble ST2.
