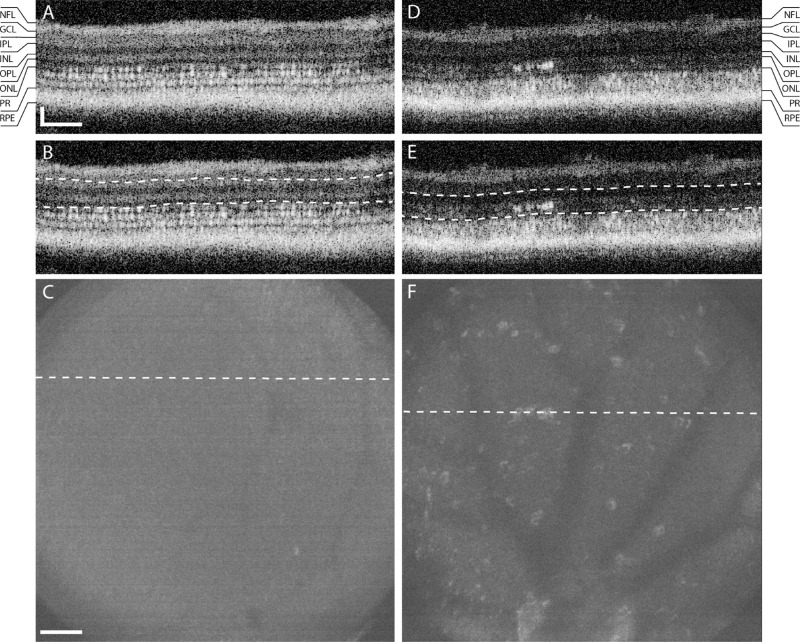
Figure 5.
OCT shows inner retinal inclusions in post-ablation zebrafish. An OCT B-scan prior to UV cone ablation (A) shows intact cone structure. The en face image from the ONL to the INL (B, dashed lines), shows a homogenous low-intensity image (C, dashed line indicates the location of A). In the same fish at 3 DPA, B scans show hyperreflective signal in the ONL (D). The corresponding en face image shows that these inclusions can be seen across the volume (F, location of D indicated by dashed lines). Scale bar: 50 µm axially and laterally.

