Figure 1.
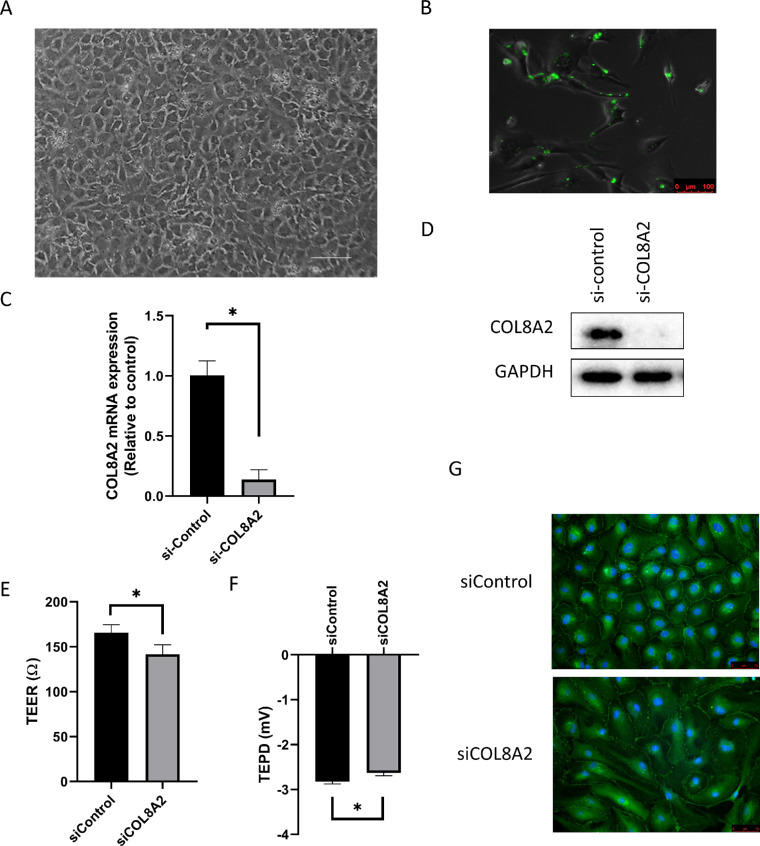
Transfection of siCOL8A2. (A) Cultured human corneal endothelial cells show mosaic pattern. Bar scale = 150 µm. (B) FITC-conjugated siRNA was observed after transfection. Bar scale = 100 µm. (C and D) After siCOL8A2 transfection, COL8A2 expression was evaluated using RT-PCR, and confirmed by western blotting. (E) TEER and (F) TEPD in siControl and siCOL8A2 of cultured hCECs. TEER and TEPD were disrupted in siCOL8A2. (G) Immunofluorescence staining for ZO-1 (green). Blue is DAPI for nuclear staining. Bar: 50 µm. *Statistically significant.

