Figure 4.
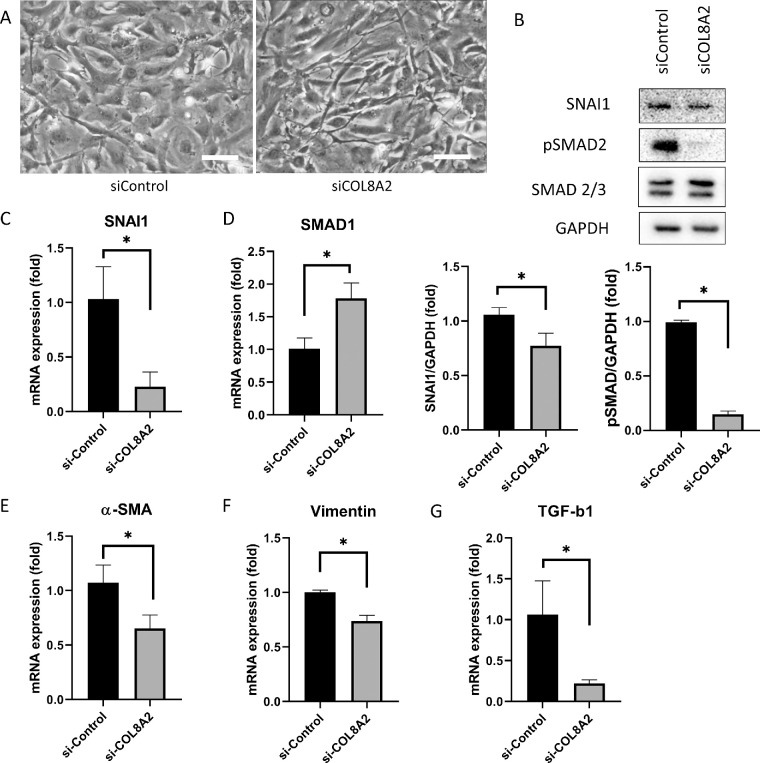
Endothelial-mesenchymal transition. (A) Cell shape was changed in siCOL8A2. Bar: 100 µm. (B) SNAI1 and pSMAD2 expressions in siControl and siCOL8A2. (C) mRNA expression of SNAI1 was reduced in siCOL8A2 compared to siControl. (D) mRNA expression of SMAD1 was increased in siCOL8A2 compared to siControl. (E, F, and G) mRNA expressions of α-SMA, vimentin and TGF-β1 in siControl and siCOL8A2. *Statistically significant.

