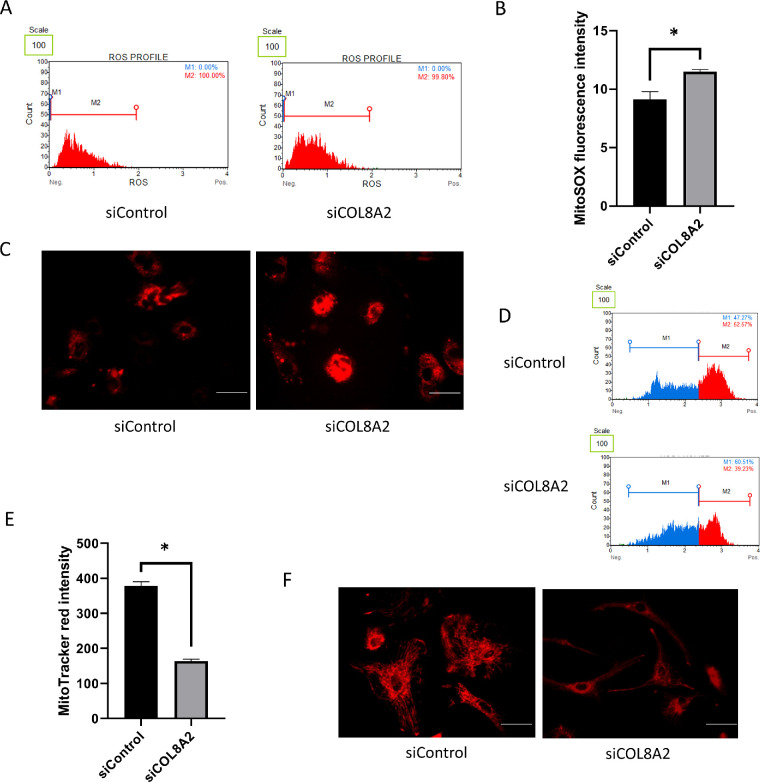
Figure 6.
Mitochondrial functions. (A and B) Mitochondrial oxidative stress measured by MitoSOX probe in siControl and siCOL8A2. (C) Representative pictures for MitoSOX staining. Bar: 50 µm. (D and E) Mitochondria membrane potential measured by MitoTracker red. (F) Representative pictures for MitoTracker red staining. Bar: 50 µm.

