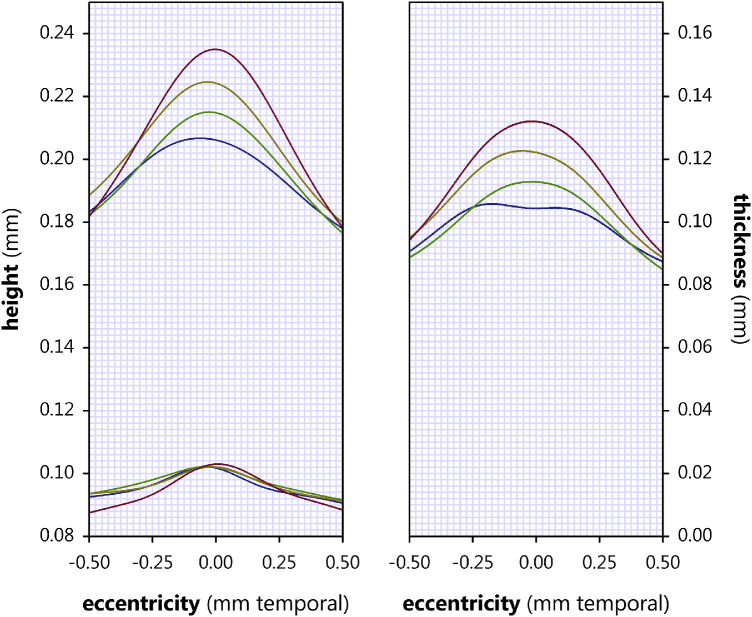
Figure 11.
Mean height of the boundaries of the ONL (left panel, replotted from Figure 9 with additional data), and their difference, ONL thickness (right panel), in term (blue lines), none (green lines), mild (yellow lines), and severe (red lines) subjects.

