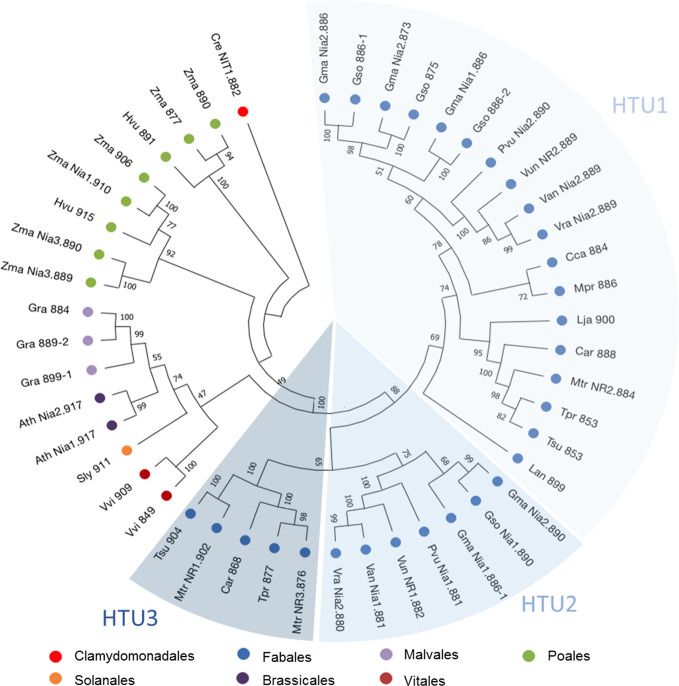
Figure 1.
Phylogenetic tree of NR protein sequences. 47 nitrate reductase sequences from model plants or belonging to the Fabaceae family were used in this analysis. The tree was inferred by maximum likelihood (ML) with MegaX (Kumar et al., 2018). Percentages displayed next to each branch represent the number of tree replicates in which the associated taxa were assembled together when performing 1,000 bootstraps. The lengths of the branches do not represent a phylogenetic distance.

