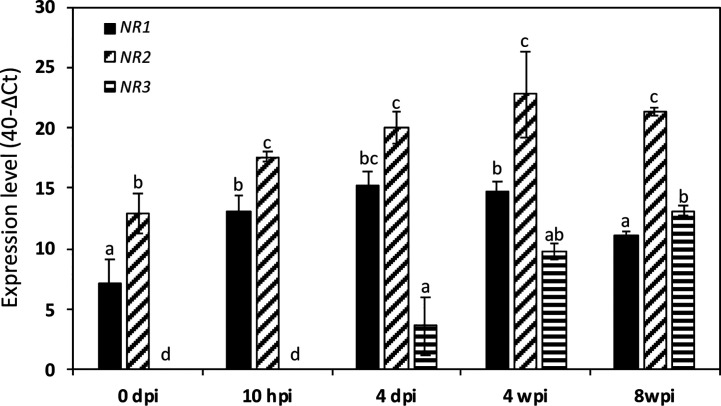
Figure 4.
Expression of Medicago truncatula NR genes at various times of the symbiotic process. The data are drawn from the same experiments as those presented in Figure 3. Values followed by different letters are significantly different according to one-way ANOVA analysis followed by a Fisher test (P<0.05). dpi, day post inoculation; hpi, hour post inoculation; wpi, week post inoculation.

