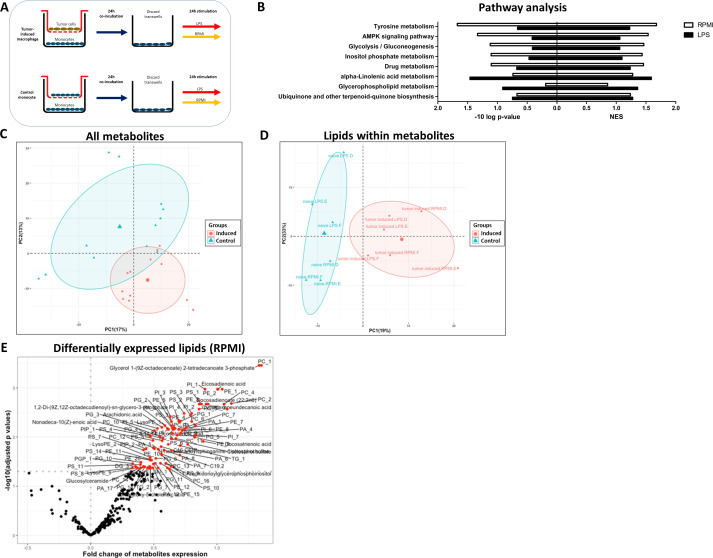
Figure 2.
Metabolome analysis of TPC-1-induced macrophages. Metabolite changes in TPC-1-induced macrophages relative to control monocytes on 24 hours rest (RPMI) and 24 hours LPS stimulation (n=3 donors). (A) Experimental setup. (B) Analysis of enriched KEGG pathways in TPC-1 – induced macrophages versus control monocytes (NES). (C) PCA plot based on all metabolites or (D) lipid metabolites specifically. (E) Volcano plot of log2 fold change and –log10 adjusted p values based on lipids in TPC-1-induced macrophages after medium (RPMI) stimulation. Red circles (p<0.05) show lipids positively enriched. NES, normalized enrichment score.

