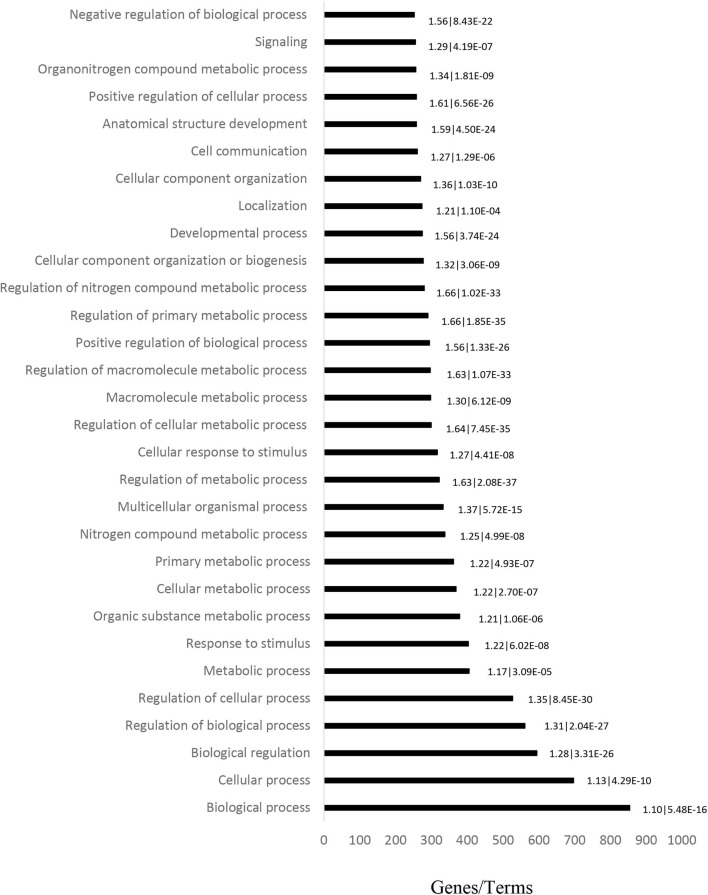
Figure 2.
Ontology analysis of differentially expressed genes in CML patient blood samples, performed to determine the main altered pathways. Horizontal bars represent the number of genes found in each term. The fold-enrichment and P-values are displayed on the sides of the horizontal bars, and are separated by a vertical line.

