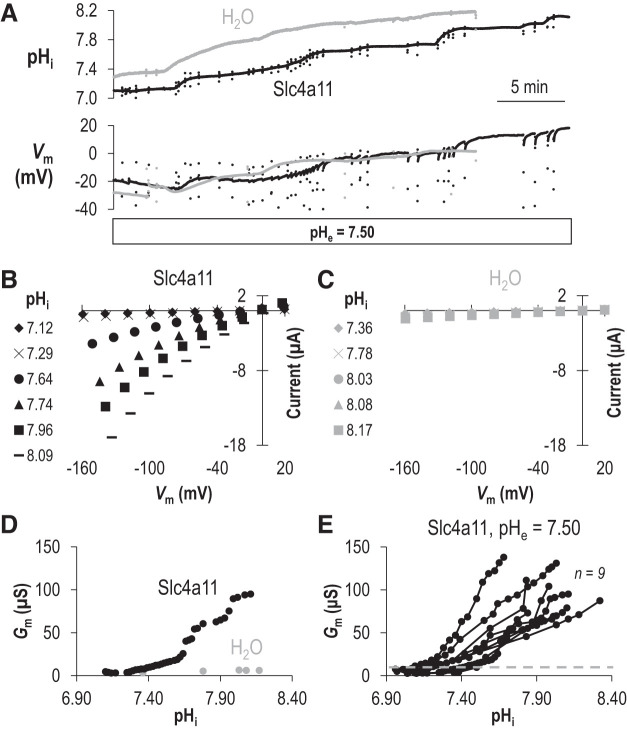
Fig. 1.
The intracellular pH (pHi) dependence of Slc4a11 activity when extracellular pH (pHe) = 7.50. A: representative recording of pHi and membrane potential (Vm) versus time as an oocyte expressing Slc4a11 (black trace) or a control H2O-injected oocyte (gray trace) is injected with NaHCO3 to raise pHi. The scattered dots represent the excursions at which current-voltage (I-V) plots were taken (which was faster than our sampling rate) B: a sampling of current-voltage relationships (I-V plots) gathered from the Slc4a11-expressing cell during the experiment shown in A. C: a sampling of I-V plots gathered from the H2O-injected cell during the experiment shown in A. D: the relationship between pHi and membrane conductance (Gm) for the Slc4a11-expressing (black) and water-control oocyte (gray) calculated from all of the I-V plots gathered during the experiment shown in A. E: data similar to that shown in D for a greater number of Slc4a11-expressing oocytes. Gray dashed line shows maximum Gm calculated from a greater number of H2O-injected oocytes (see Supplemental Fig. 1A for data points; https://doi.org/10.6084/m9.figshare.12400946).

