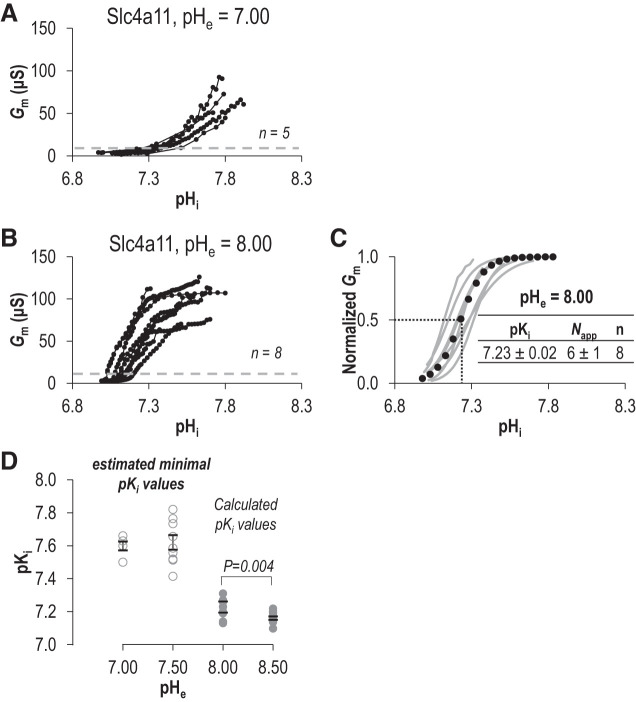
Fig. 5.
Comparison of the intracellular pH (pHi) dependence (pKi) of Slc4a11 at extracellular pH (pHe) 7.00 and 8.00. A and B: the relationship between pHi and conductance (Gm) for Slc4a11-expressing oocytes at pHe 7.00 (A) or pHe 8.00 (B). C: gray lines represent best fit to the Hill equation for each trace in B. The average value for pKi and apparent Hill coefficient (Napp) were used to generate the averaged best-fit trace shown as a black dotted-line. D: the range of pKi values at each tested value of pHe. pKi values are calculated from Hill plots fits for pHe 8.00 and 8.50 (solid circles), or estimated minimal pKi values from pHi at 50% of maximum observed Gm (open circles).

