Fig. 5.
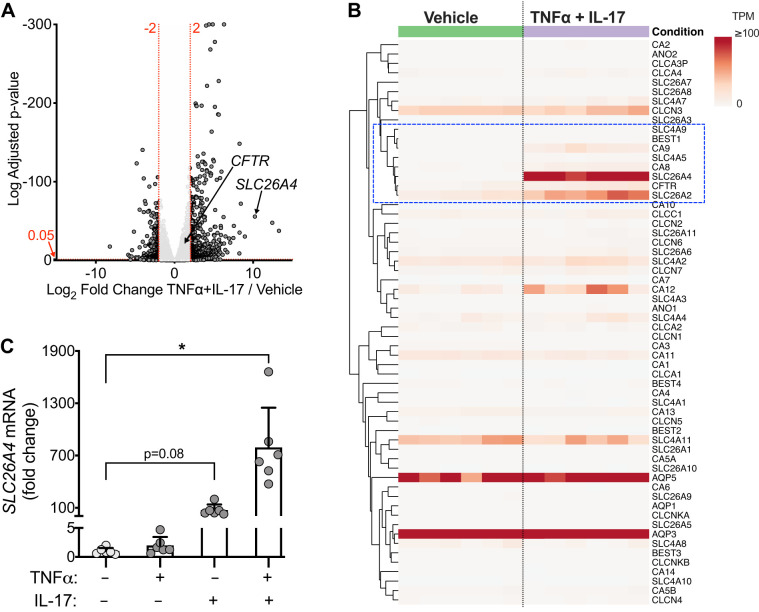
Gene expression profiling identifies SLC26A4 (pendrin) as a key non-CFTR transporter upregulated by TNFα+IL-17. Human airway epithelia were treated with vehicle or TNFα+IL-17 for 48 h, and RNA-sequencing was performed (n = 6 different donors). A: volcano plot shows TNFα+IL-17-induced gene expression changes. Each data point corresponds to a gene. A horizontal dashed line labeled 0.05 represents arbitrary cutoff of adjusted P < 0.05. Two vertical dashed lines labeled −2 and 2 represent arbitrary cutoffs of log2 fold change of −2 or less (left) and 2 or greater (right). Locations of CFTR and SLC26A4 transcripts are shown with arrows. B: differential expression of 60 transport-related genes displayed as a heatmap of raw transcripts per million reads (TPM). Columns represent epithelia from different donors, and rows represent individual genes. Heatmap and gene clustering were generated using ClustVis tool (see materials and methods). Dashed rectangle highlights a subgroup of transport-related genes upregulated by TNFα+IL-17 treatment. C: real-time PCR validation of increased SLC26A4 expression after 24 h of TNFα+IL-17 (n = 6 per group). Bars indicate means and SD. *P < 0.05 by repeated measures ANOVA and Dunnett’s multiple comparisons test.

