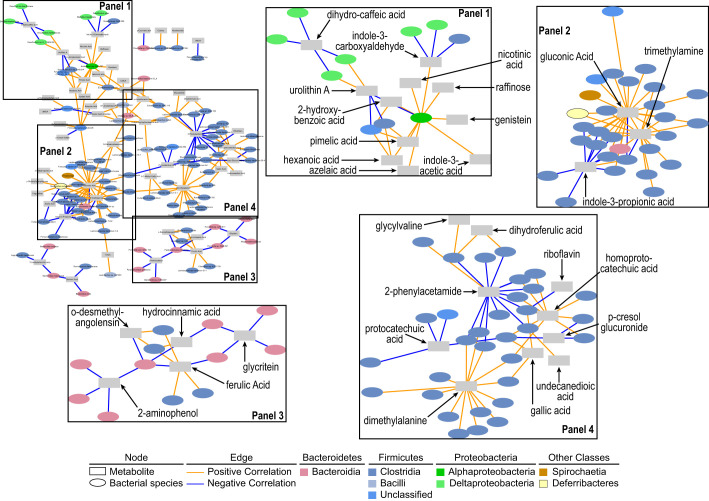
Fig. 6.
Spearman’s correlation network of xenometabolites and bacterial species in UCD-T2DM rats before the onset of diabetes (PD; n = 9) and recent onset (RD; n = 10). PD and RD rats were combined to increase statistical power before correlation analysis. Edges (i.e., correlations) connect xenometabolites (rectangles) and bacterial species (ovals) at P < 0.05. Orange edges indicate Spearman’s rho > 0 and blue edges indicate Spearman’s rho < 0. Network at top left is the full network. Labeled boxes in the full network are enlarged and adjacent to the full network. Xenometabolites are only annotated in the enlarged panels for clarity. The full network is provided in a larger format in Supplemental Fig. S2.

