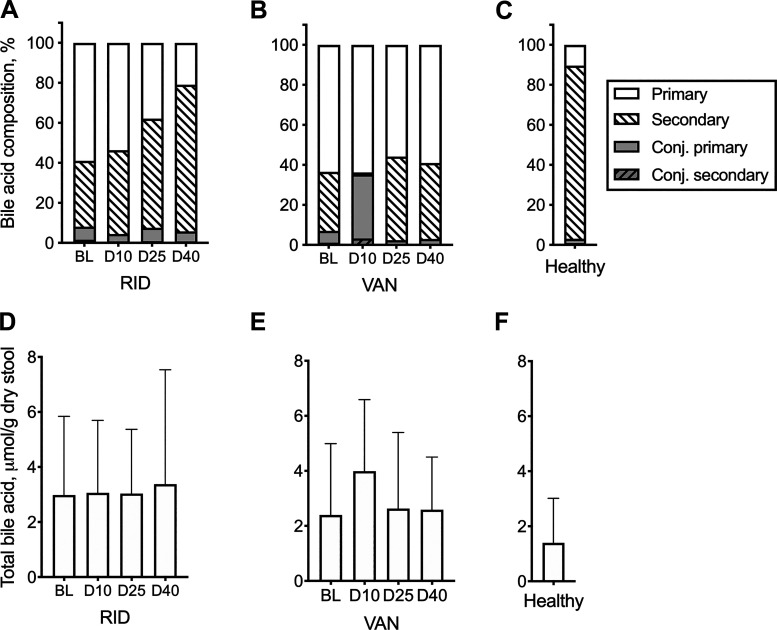
Fig. 2.
Bile acid (BA) composition in treated subjects and healthy controls. BA composition was calculated for ridinilazole (RID; A), vancomycin (VAN; B), and healthy subjects (C) as %total/g dry wt of stool. Corresponding total BA concentrations are shown in D–F, respectively. See Table 1 for BA groupings. Differences in changes across time and treatment were assessed using a linear mixed-effect model (SAS 9.4). Statistically significant outcomes were relative abundances of secondary and conjugated primary BA. BL, baseline; D10, day 10; D25, day 25; D40, day 40.

