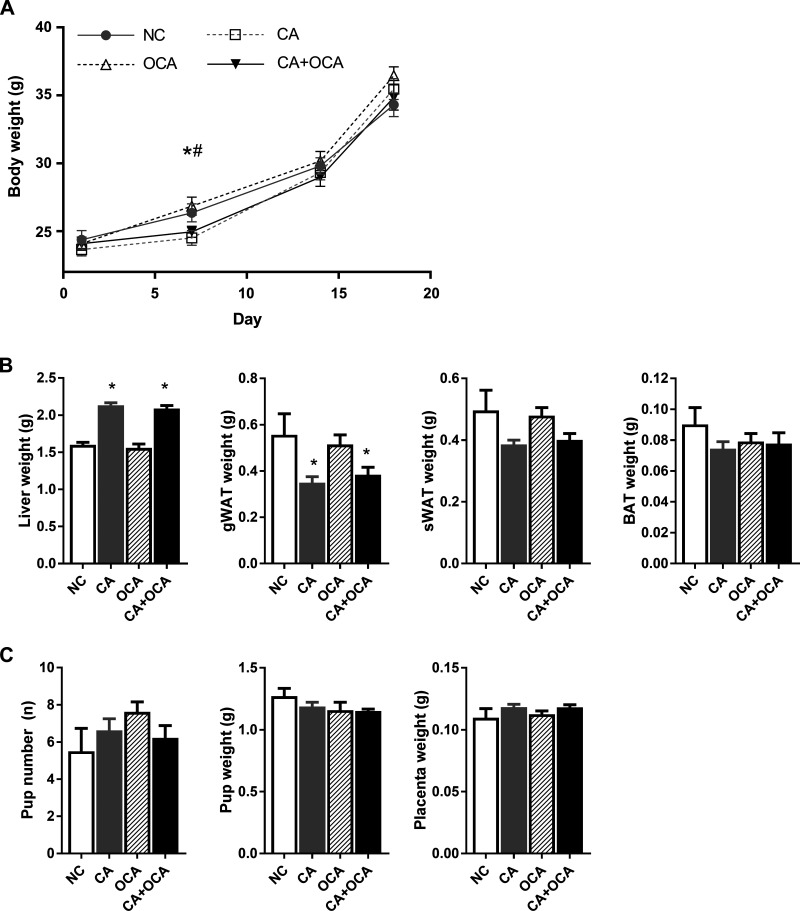
Fig. 1.
Effects of hypercholanemia and obeticholic acid (OCA) treatment during pregnancy on body and organ morphometry. A: body weight of pregnant females on days 1 (D1), 7 (D7), 14 (D14), and 18 (D18). #P ≤ 0.05 for cholic acid (CA) vs. OCA; *P ≤ 0.05 for CA + OCA vs. OCA groups. B: weight of liver, gonadal white adipose tissue (gWAT), subcutaneous white adipose tissue (sWAT), and brown adipose tissue (BAT) of pregnant females on D18. C: pup number, pup weight, and placenta weight of D18 fetuses. *P ≤ 0.05 in comparisons vs. normal chow diet (NC) and OCA groups. Data are presented as means ± SE; n = 6–9 mice.

