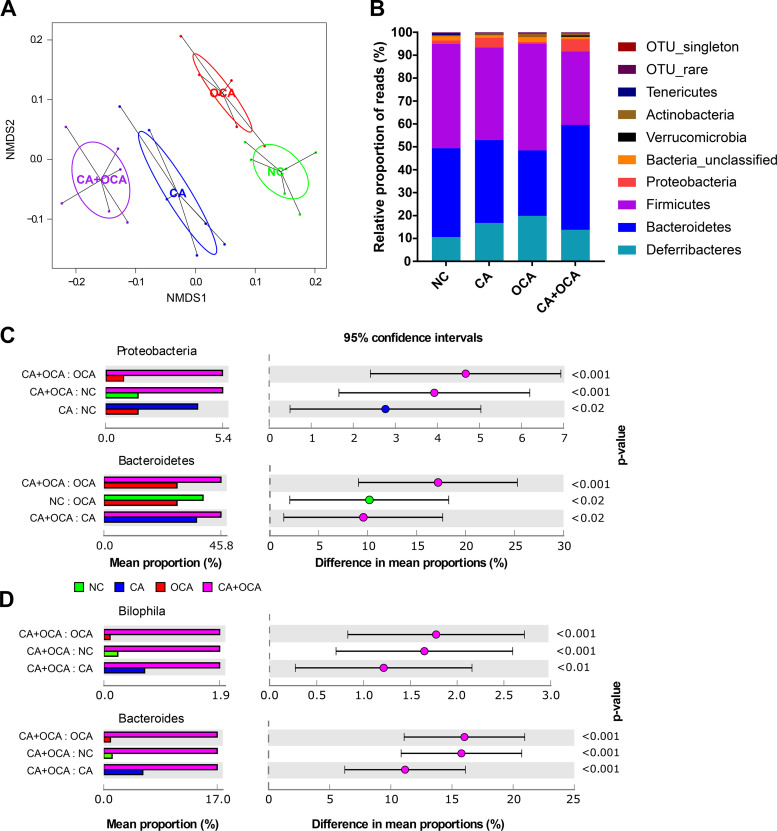
Fig. 4.
Changes in cecal microbiota in pregnant mice measured by 16S rRNA gene sequencing. A: nonmetric multidimensional scaling (NMDS) plot showing differences in bacterial community structure based on the weighted UniFrac distance metric. For P values, see Supplemental Table S2. B: changes in relative proportion of reads at phylum level. C and D: significant changes in the average relative proportion of sequences assigned to each taxa for each dietary group at phylum (C) and genus level (D). Data presented as extended error bar plots showing P value, effect size, and confidence interval for each taxa. Analyzed by Kruskal-Wallis H test with Benjamini-Hochberg false discovery rate; n = 6 mice/group. CA, cholic acid; NC, normal chow diet; OCA, obeticholic acid.

