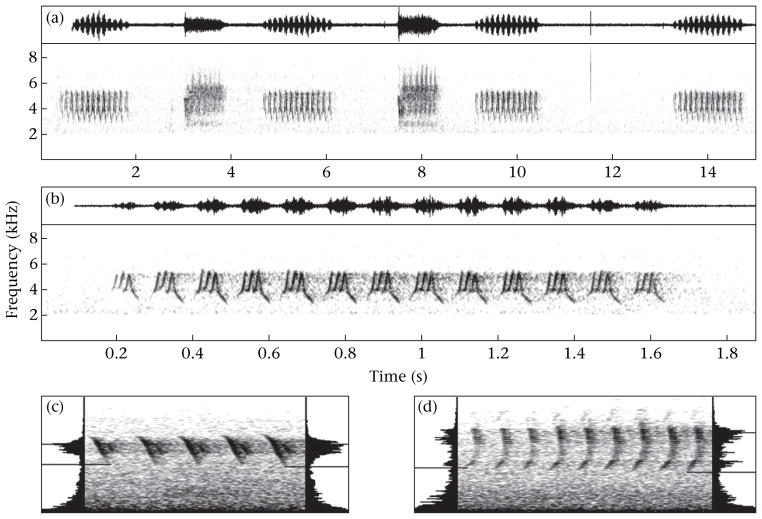
Figure 1.
Waveform and spectrogram of (a) part of a dark-eyed junco song bout (in this case four songs interspersed with two spotted towhee songs at 3 and 8 s) and (b) the last song, showing slight differences in amplitude between songs and the softer initial and final syllables of each song compared to the central syllables. (c) and (d) Spectrograms of two songs (beginning to middle of song; spectrogram axes as in (b)) recorded amid urban noise with power spectra in the end panels for the two outer syllables represented, illustrating that minimum frequency can be measured visually on spectrograms (horizontal lines) even when embedded in noise of similar amplitude.

