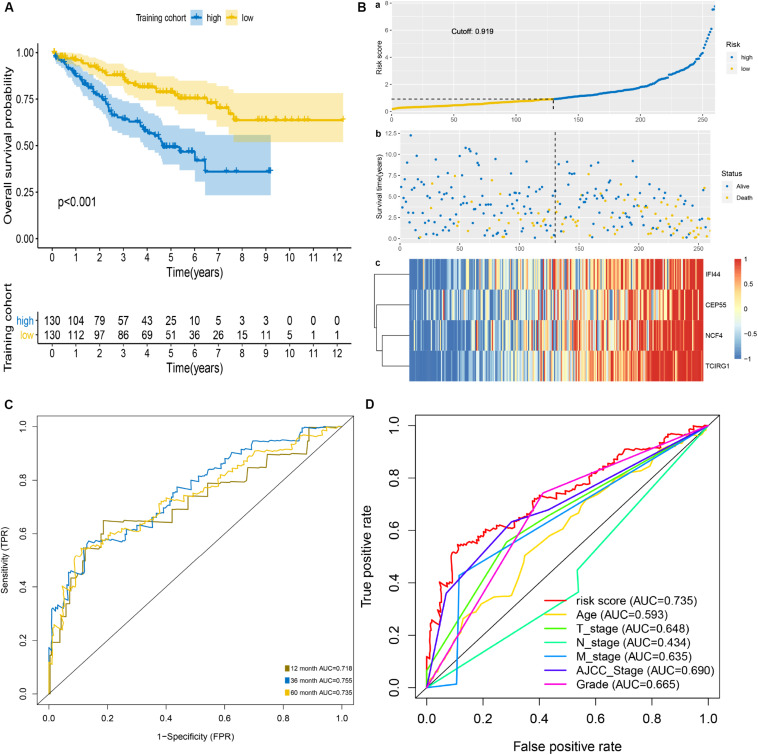
FIGURE 2.
Prognostic analysis of mRNASig in the training cohort. (A) Kaplan–Meier analysis of mRNASig. (B) The distribution of risk score (a), survival status (b), and mRNAs expression levels of patients (c) in training cohort. (C) Time-dependent ROC analysis of mRNASig. (D) Comparison of the predictive power among risk score, age, AJCC-stage, T-stage, N-stage, M-stage, and grade.

