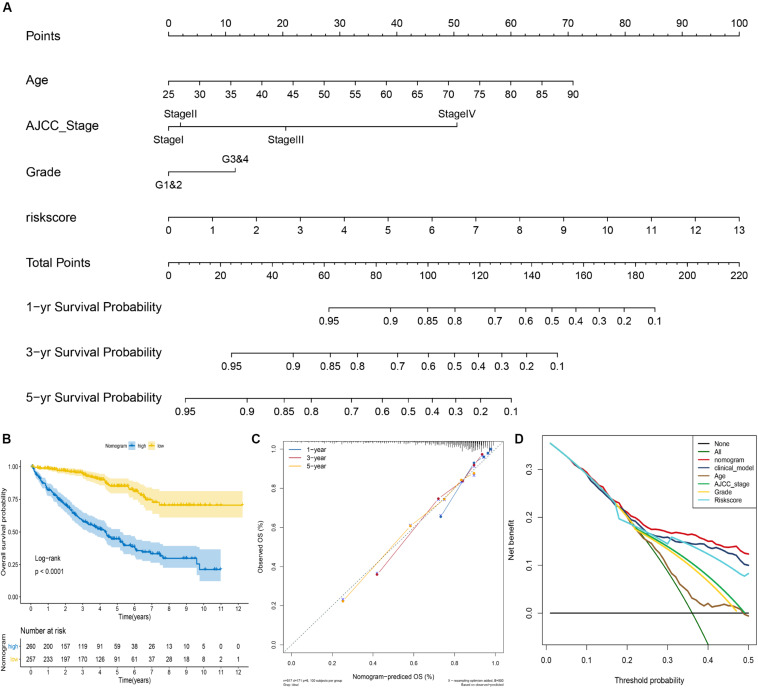
FIGURE 4.
Construction of the nomogram for predicting overall survival of ccRCC in the entire cohort. (A) The nomogram predicting 1-, 3-, and 5-year overall survival of ccRCC. (B) Kaplan–Meier analysis of the nomogram. (C) The calibration plot for internal validation of the nomogram. (D) Decision curve analysis for 5-year overall survival prediction shows that the nomogram had the highest net benefit across 0–50% threshold probabilities.

