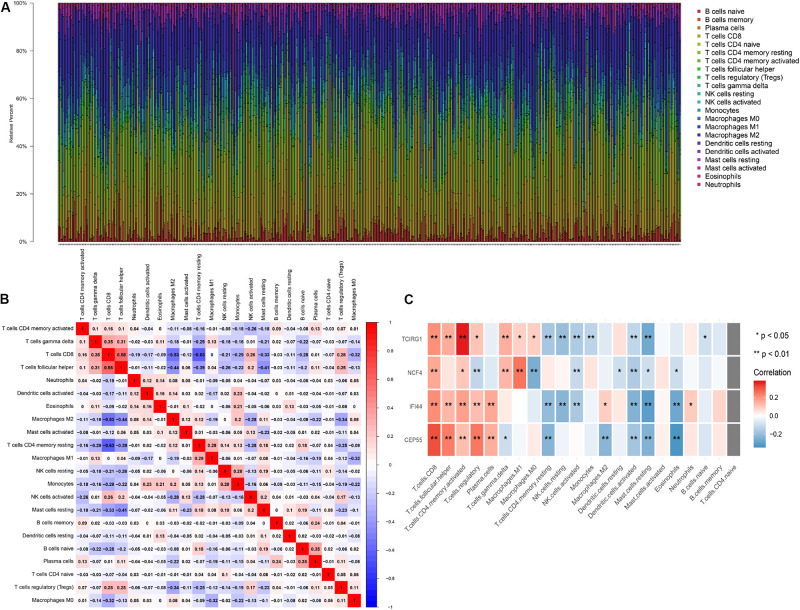
FIGURE 8.
The landscape of immune infiltration in TCGA ccRCC patients. (A) The abundance fraction of 22 tumor-infiltrating lymphocytes (TILs) in the 396 ccRCC samples. Each column represents a sample, and each column with a different color and height indicates the abundance fraction of TILs in this sample. (B) The correlation between the abundance fraction of various immune cells. The value represents the correlation value. Red represents a positive correlation, and blue represents a negative correlation. (C) The relationship between expression of CEP55, IFI44, NCF4, and TCIRG1 and 22 TILs.

