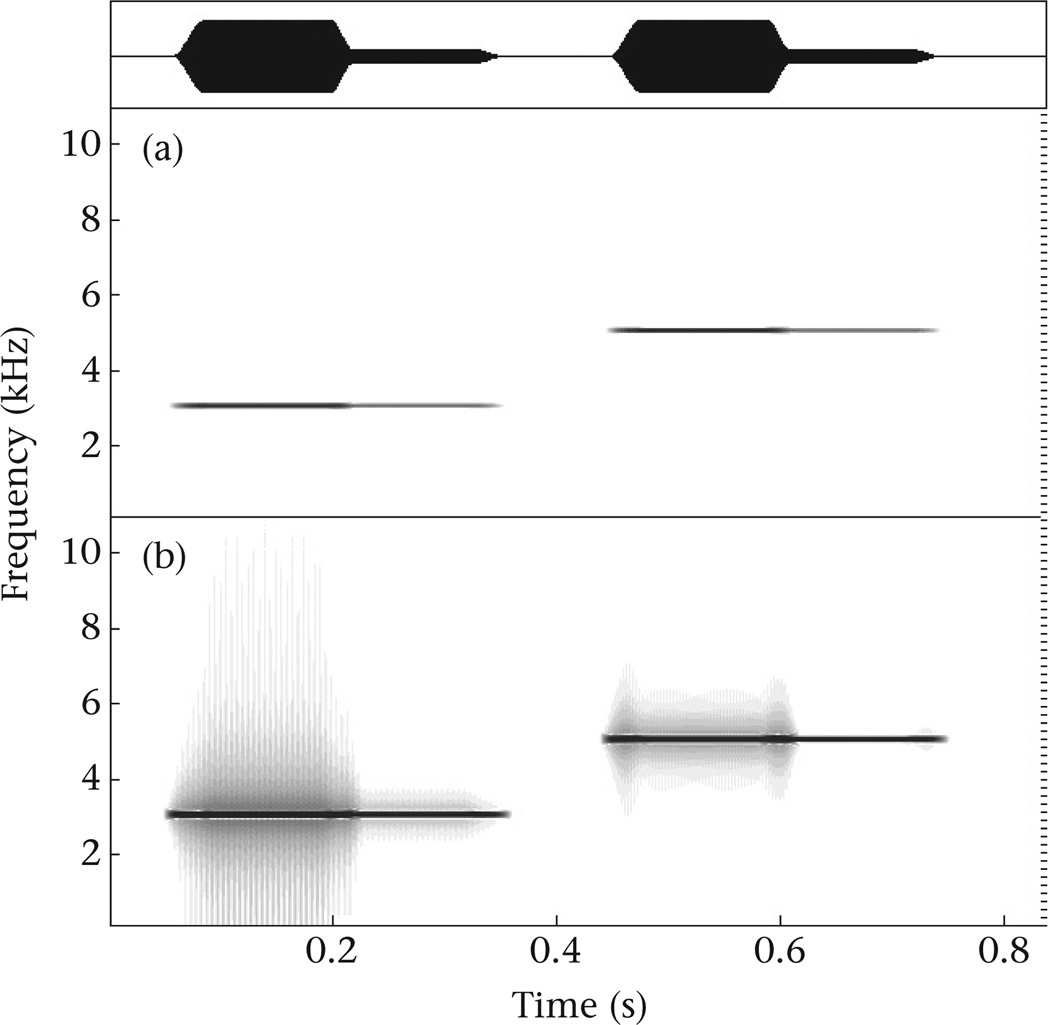
Figure 1.
(a) Spectrogram of pure tones increasing midway by 14 dB, the maximum amplitude differences in our analyses, showing only a negligible change in extreme frequencies as measured from spectrograms. (b) The same pure tone sounds after decreasing the dynamic range of the spectrogram to produce shading around the higher-amplitude sounds. Waveform in the top panel. Pure tones and spectrograms generated with Avisoft SASLab-Pro v.5.2 (Avisoft Bioacoustics, Berlin). Spectrogram settings are the same as those used for measurements and illustrations in our original article: FFT length of 512, hamming window, 100% window duration, 93.75% overlap and asymptotic greyscale of relative amplitude (i.e. contrast = ‘char1.grd’ in Avisoft SASLab-Pro) on sound files with 22.050 Hz sampling rate. Black lines at the right side of spectrograms mark 5-pixel intervals.

