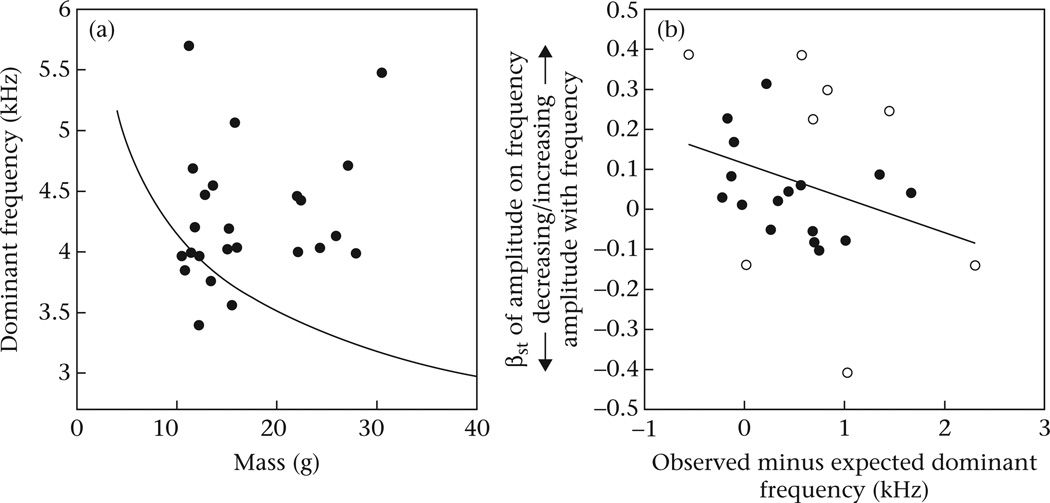
Figure A1.
(a) Dominant song frequency and body mass of Serinus spp. (dots) compared with the allometry between those traits for passerines (curved line). (b) Standardized regression coefficients (βst) quantifying the direction and strength of covariation between amplitude and dominant frequency of syllables, plotted against the difference between dominant song frequency and predicted frequency for each species’ body mass. The regression line across species is indicated; we report a simple linear regression because phylogenetic signal for song frequency is negligible (Cardoso & Mota 2007; Cardoso et al. 2012). White dots denote species with significant covariation of frequency and amplitude after controlling for multiple comparisons (Cardoso & Mota 2009). Dominant song frequency and standardized regression coefficients from Cardoso & Mota (2009), allometry between body mass and dominant frequency from Wallschläger (1980), and body masses from Dunning (2008), with one missing value substituted by predicted mass using the linear regression equation of mass on body length for the remaining 23 species (lengths for all 24 species from Clement et al. 1993).

