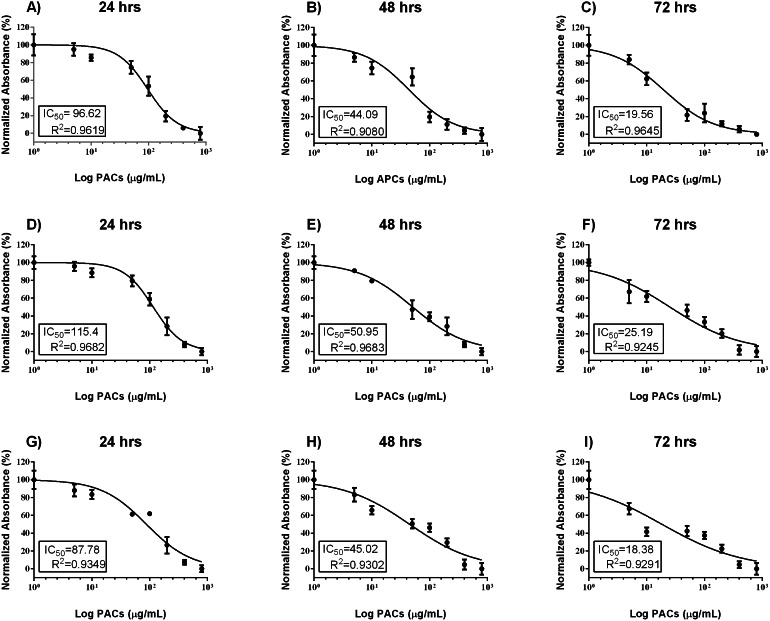
Figure 2. PAC dose-response inhibition curves in HT29, MCF-7, and PC-3 cells.
(A–C) HT-29, (D–F) MCF-7, and (G–I) PC-3 cells were exposed to 0, 5, 10, 50, 100, or 200 μ g/mL PACs for 24, 48, and 72 h. Viability was measured by MTT assays. The mean of three experiments (n = 3) were plotted to calculate the IC 50 and R2 values by non-linear regression analysis. The error bars represent SD.

