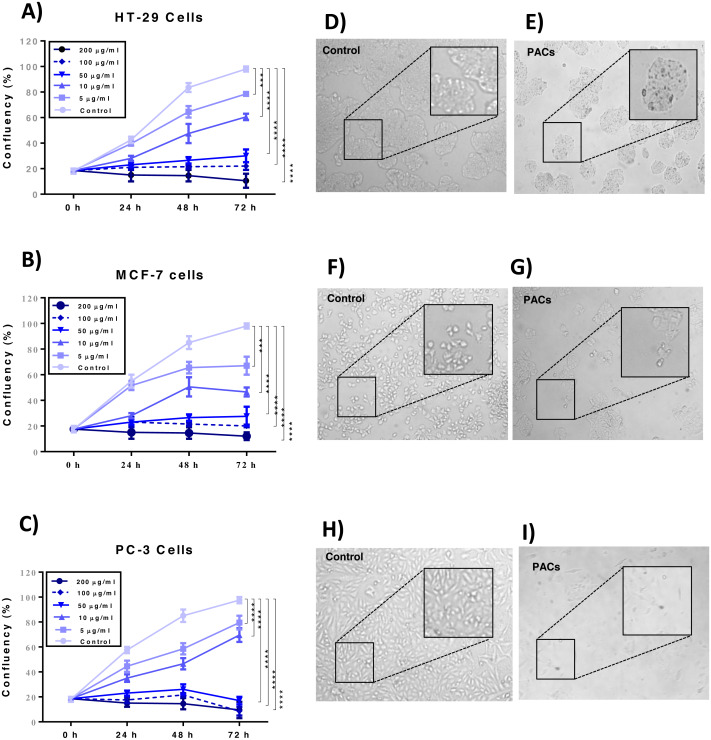
Figure 4. Proliferation of HT29, MCF-7, and PC-3 cells after PACs treatment.
(A) HT29, (B) MCF-7, and (C) PC-3 cell confluency percentage compared to untreated cells after 0, 5, 10, 50, 100, or 200 μ g/mL PACs for 24, 48, and 72 h. Cells were counted using trypan blue exclusion. The obtained data were analyzed by two-way ANOVA. The data represent the mean ± SD of three independent experiments. Cell morphology in (D, E) HT29, (F, G) MCF-7, and (H, I) PC-3 cells after treatment with PACs at the LC50 dose for 72 h (magnification: 10X). ns: p > 0.05, ∗p < 0.05, ∗∗p < 0.01, ∗∗∗p < 0.001 vs. control.

