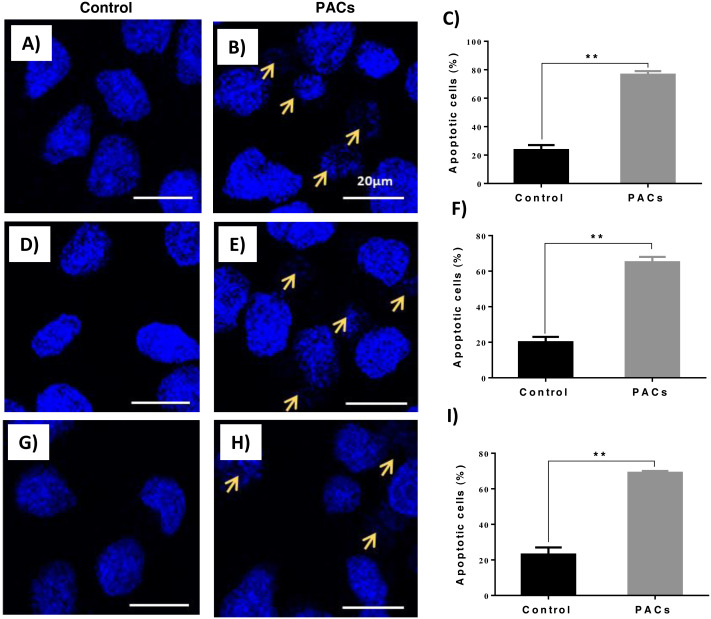
Figure 6. Apoptotic nucleus morphology in HT29, MCF-7, and PC-3 cells after PACs treatment.
In total, 2 ×10⁵ cells/well were cultured in 6 well plates. After 24 h incubation, cells were treated with PACs at their respective IC50 doses. Nuclear morphology was observed after 24 hours. The obtained data were analyzed using Student’s t-test compared to control cells. The mean ± SD of three biological replicates is plotted. (A–C) HT29, (D–F) MCF-7, and (G–I) PC-3, ns: p > 0.05, ∗p < 0.05, ∗∗p < 0.01, ∗∗∗p < 0.001 vs. control.

