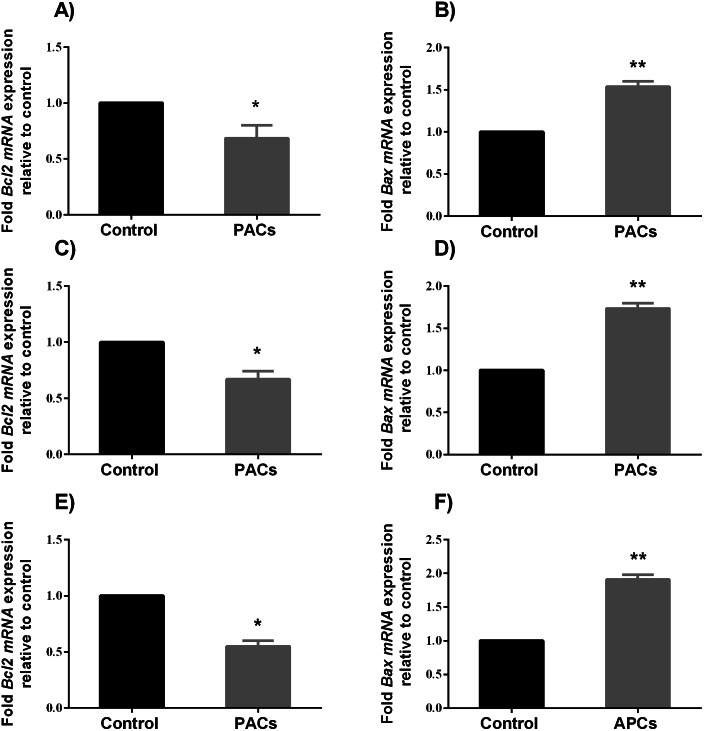
Figure 8. BCL-2 and BAX expression in HT-29, MCF7, and PC3 cancer cells.
In total, 106 cells/well were seeded in 6-well plates and treated with PACs at their respective IC50 concentration for 24 h. ΔΔ Ct method was used to calculate the mRNA expression level between treated cells and control. The Y-axis represents the fold of mRNA expression level. The data were analyzed using Student’s t-tests compared to control cells. The mean ± SD of three biological replicates is plotted. (A, B) HT29, (C, D) MCF-7, and (E, F) PC-3, ns: p > 0.05, ∗p < 0.05, ∗∗p < 0.01, ∗∗∗p < 0.001 vs. control.

