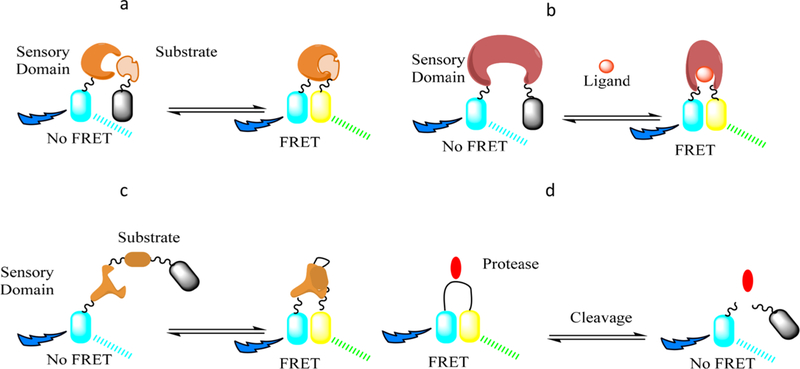
Figure 8.
FRET biosensor design strategies. The two fluorescent molecules are represented by the cyan and yellow cylinders, while the gray color indicats the lack of signal from the respective protein. (a) The donor molecule is attached to a sensory domain, while the acceptor is linked to the corresponding substrate, generating a FRET signal once they are binding. (b) Both proteins are connected to a single sensory domain that changes its conformation upon binding to a particular ligand. (c) Both substrate and sensory domain are linked in a singular probe. (d) An opposite strategy starts with the two proteins connected in close proximity to generate a FRET signal and detects the disappearance of it as the linker is cleaved/ stretched in the biological media.

