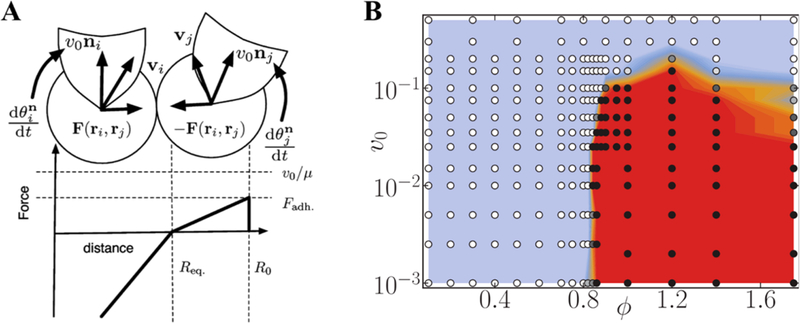
Figure 9.
(A) Schematics showing intercellular forces as well as self-propelled velocity directions. (B) Phase diagram showing the transition from the liquid state (blue region) to the solid state (red region). Panel A reprinted with permission from ref 59. Copyright 2006 American Physical Society. Panel B reproduced with permission from ref 156. Copyright 2011 American Physical Society.

