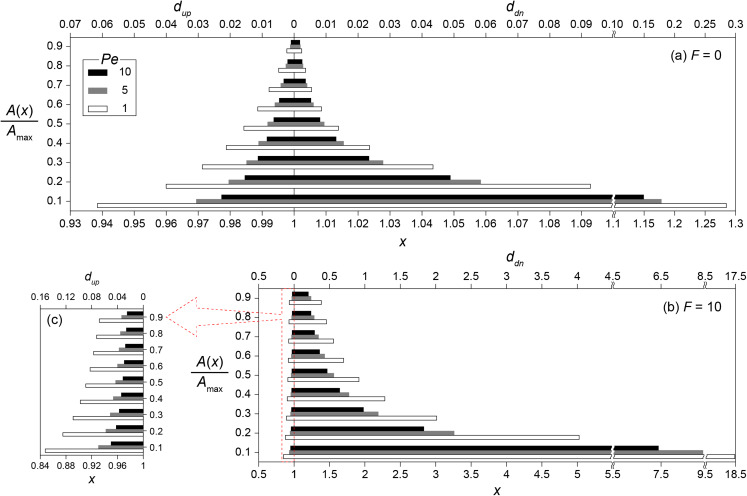
Figure 4. Transport distances of signaling molecules with and without autoinduction.
Upstream (dup) and downstream (ddn) transport distances (A) without (F = 0) and (B) with (F = 10) enhanced signal production for the concentration ratios (0.1 ≤ A/Amax ≤ 0.9) at Pe = 1, 5 and 10, and (C) the enlarged barplot of upstream transport distances with F = 10. Note the different scale of the horizontal axes between panels.

