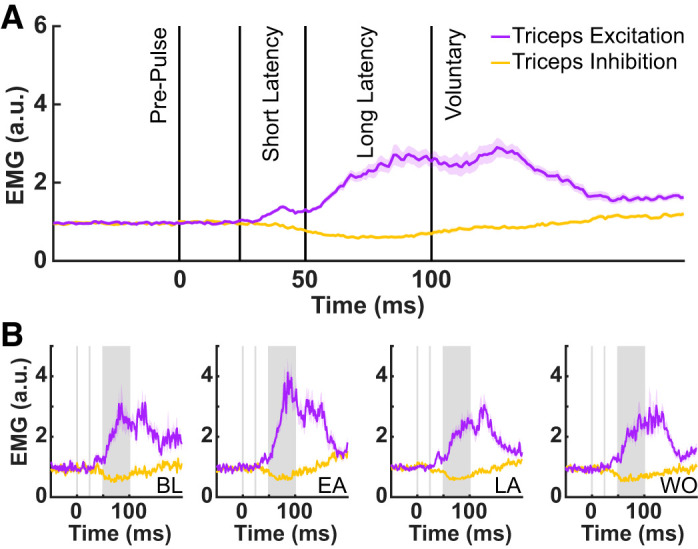
Fig. 3.

A: triceps EMG following force pulse probe trials, averaged across all phases of learning and all participants, for trials in which the triceps was stretched (purple) or released (yellow); a.u., arbitrary units. Data are aligned to force pulse onset (time = 0 ms), and solid vertical lines indicate the different phases of the feedback response. B: triceps EMG following force pulse probe trials during 4 phases of learning (BL, baseline; EA, early adaptation; LA, late adaptation; and WO, washout).
