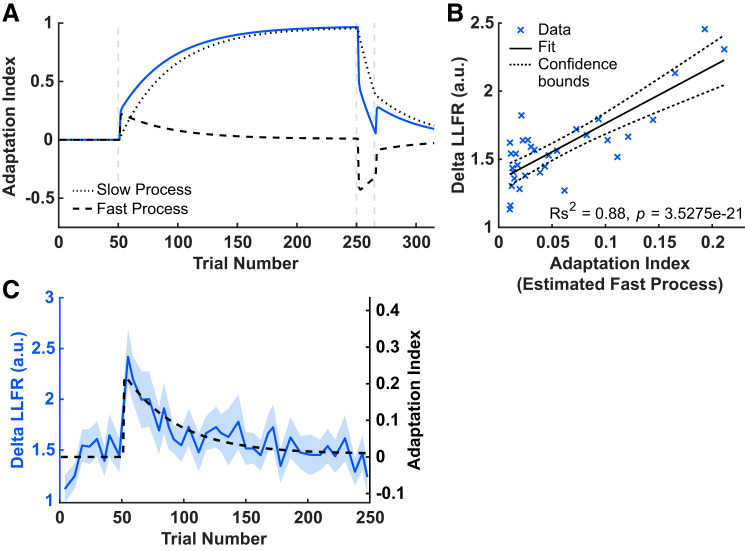
Fig. 7.
Relating feedforward and feedback control. A: model simulation. The overall output predicted by the model is shown as a solid blue line. The fast process (dashed black line) and the slow process (dotted black line) are shown as a function of trial. B: correlation between the mean value, averaged across participants, of the delta the long-latency feedback response (LLFR) during the adaptation phase, averaged across participants, and the corresponding value of the estimated fast process at each trial at which the delta LLFR is measured during the adaptation phase; a.u., arbitrary units. C: the time course of the fast process (estimated from the feedforward probes, shown as a black dashed line), overlaid on the time course of the measured delta LLFR (shown as blue solid line). The shaded region denotes SE.

