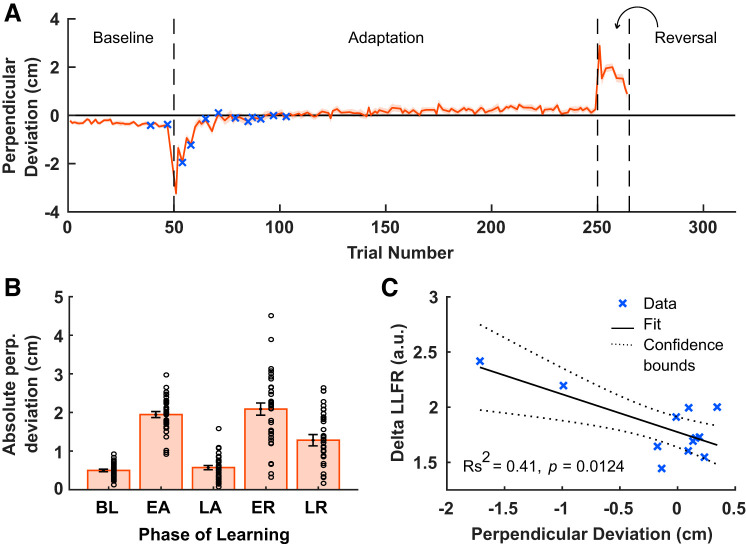
Fig. 8.
Relating feedback to movement error. A: average perpendicular deviation of the hand path measured at peak velocity, as a function of adaptation trial. The shaded region denotes SE. B: comparison of the mean absolute value of perpendicular deviation for the 4 trials in each phase of learning. Circles represent individual participants. C: correlation between the delta the long-latency feedback response (LLFR) and perpendicular deviation of the hand, for 12 trials near the beginning of adaptation (shown in A using a blue x); a.u., arbitrary units. Dashed lines indicate 95% confidence interval (CI).

