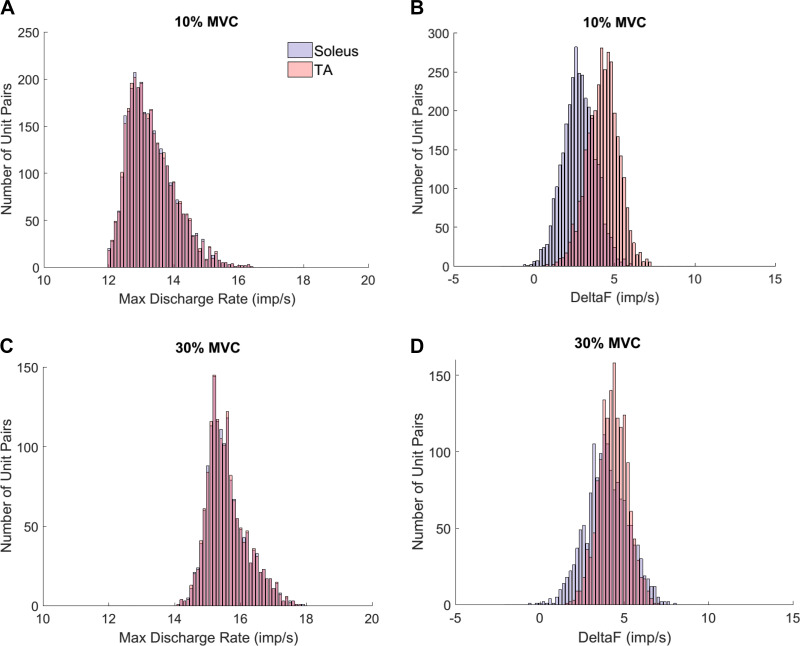
Fig. 6.
Delta-F (ΔF) after matching maximum discharge rates. A: under 10% maximum voluntary contraction (MVC) condition, there was no statistical difference between the maximum discharge rates of the matched soleus (13.35 ± 0.75 imp/s) and tibialis anterior (TA) (13.35 ± 0.75 imp/s) unit pairs (P = 0.50). B: the matched ∆F values of the soleus (2.87 ± 1.00 imp/s) and TA (4.38 ± 0.97 imp/s) units were significantly different (P < 0.00001). C: there was no statistical difference (P = 0.33) in maximum discharge rates between the muscles under 30% MVC condition (soleus = 15.64 ± 0.62; TA = 15.64 ± 0.62). D: statistical significance was observed between the matched ∆F values of the soleus (4.06 ± 1.27) and TA (4.44 ± 0.84) (P < 0.00001).

