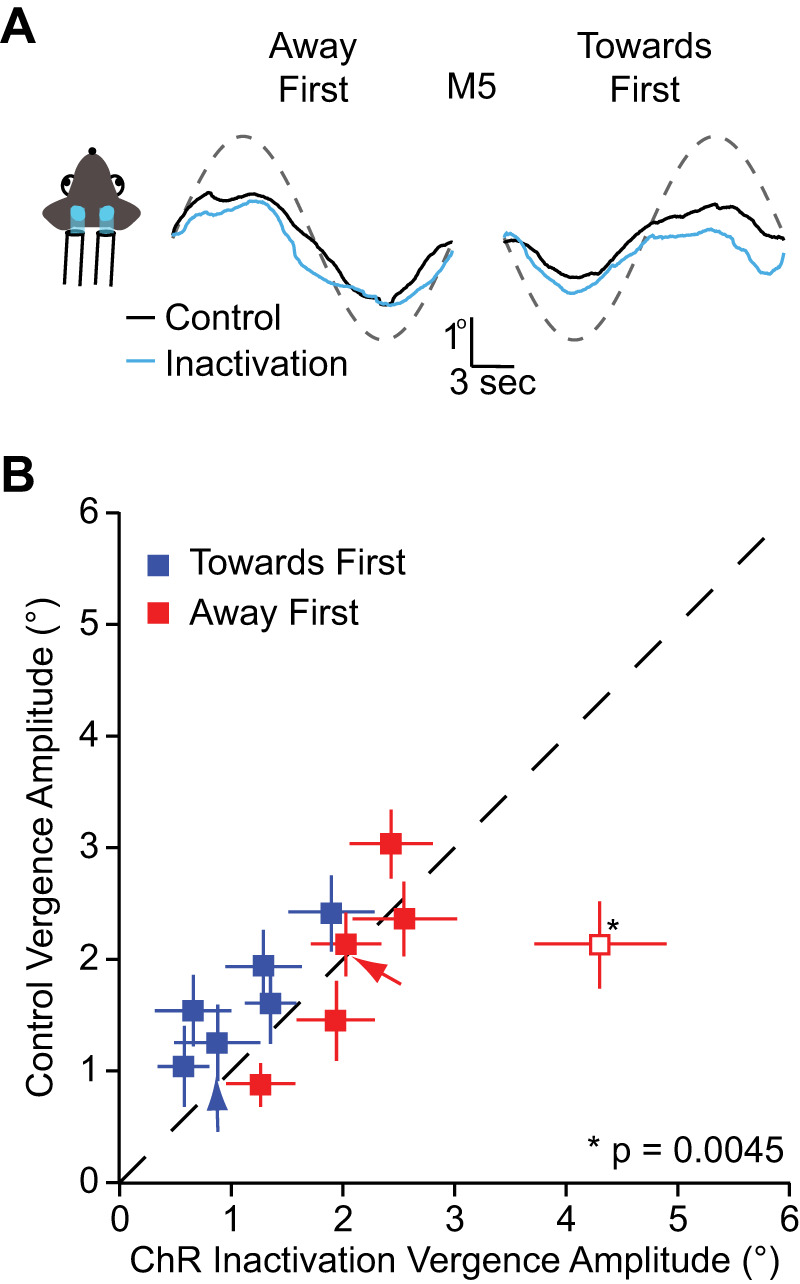
Fig. 5.

Visual cortex inactivation and vergence eye movements A: mean vergence eye movements of animal [mouse 5 (M5)] during visual cortex inactivation for the toward first (left) and the away first conditions (right). Red line indicates the mean vergence eye movements during control condition while the cyan line indicates vergence during inactivation. B: vergence amplitude comparison between control condition and channelrhodopsin-2 (ChR2) condition for toward first and away first stimulus across animals. Error bars indicate means ± SE of the individual animals. One animal had a statistically different vergence amplitude during inactivation (P = 0.0045). For that animal, vergence was larger during inactivation than in control conditions.
