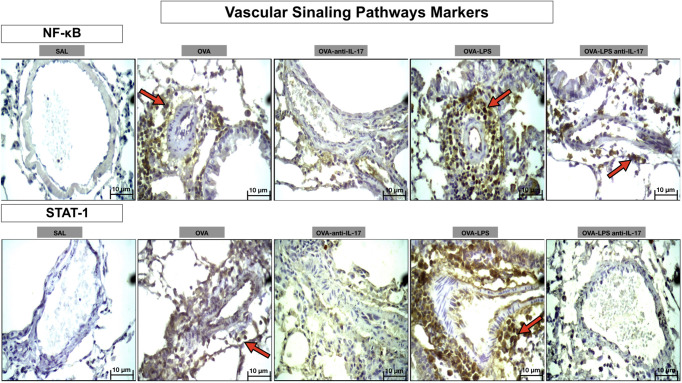
Figure 11.
Qualitative analysis of vascular signaling pathways. Photomicrographs showing the presence of inflammation around the pulmonary vessels. The slides were stained for NF-kB and STAT-1-expressing positive cells. The experimental groups include SAL, OVA, OVA-anti-IL-17, OVA–LPS, and OVA–LPS-anti-IL-17. The red arrows indicate the positive cells for NF-kB and STAT-1.

