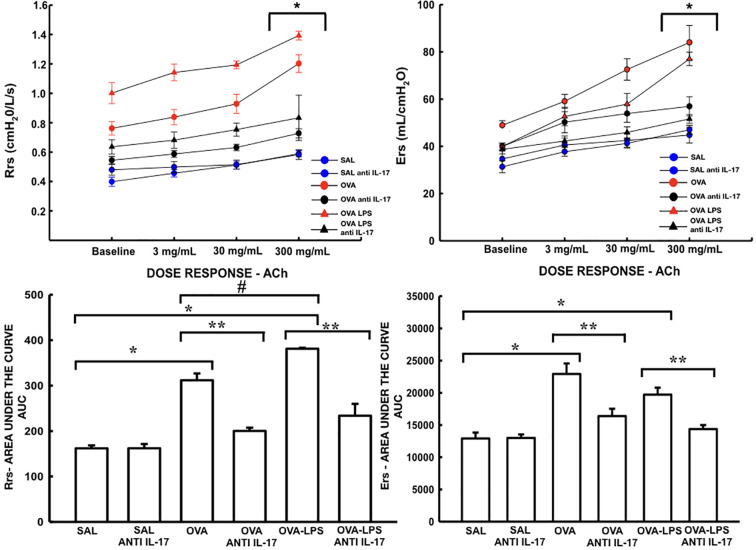
Figure 5.
Effects of anti-IL-17 treatment on resistance (Rrs) and elastance (Ers). Dose/response curves of methacholine dose/3, 30, and 300 mg/ml. Data are presented as mean ± sem. The differences were considered significant when p < 0.05. *p < 0.05 vs. baseline. Values of the logarithm of the area under the curve (AUC) of resistance (Rrs) and elastance of the respiratory system (Ers) were considered a significant difference when p < 0.05. *p < 0.05 vs. SAL group; **p < 0.05 vs. OVA and OVA–LPS groups. #p < 0.05 vs. OVA group.

