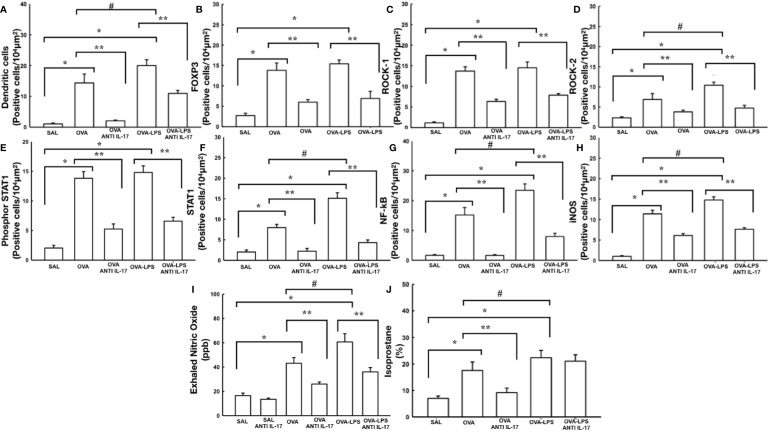
Figure 9.
Effects of anti-IL 17 treatment on antigen-presenting cells (A), FOxP3 (B), signaling pathways (C–G), and oxidative stress (H–J). The values represent the mean ± SE of dendritic cells, FoxP3, ROCK-1, ROCK-2, Phosphor-STAT1, STAT1, NF-k, iNOS, NOex, and isoprostane for all experimental groups. The differences were considered significant when p < 0.05. *p < 0.05 vs. SAL group; **p < 0.05 vs. OVA and OVA–LPS groups. #p < 0.05 vs. OVA group.

