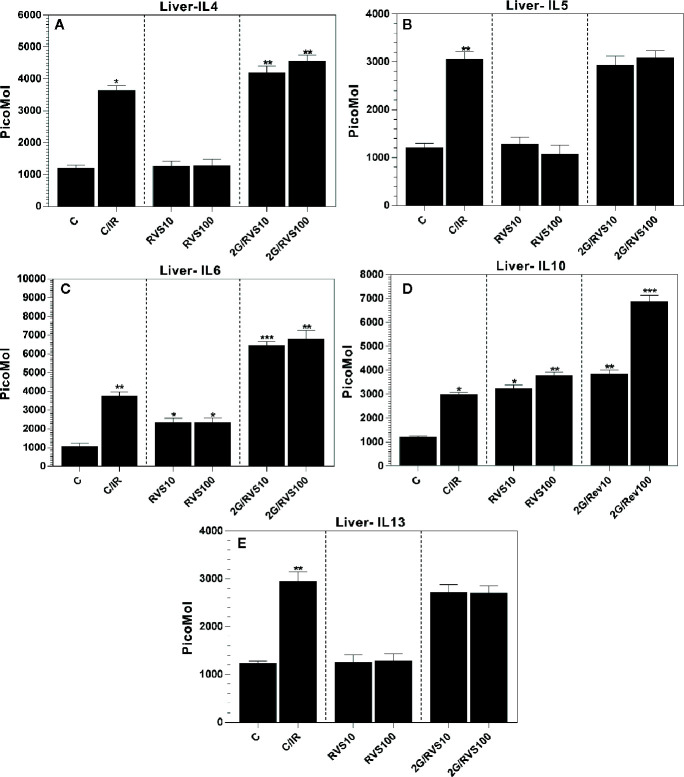
Figure 2.
The cytokine profiles in Wistar rat liver produced by Th2 cells, which include (A) IL-4, (B) IL-5, (C) IL-6, (D) IL10, and (E) IL-13 in six rat groups. (C, control group; C/IR, irradiated rats, RSV10 and RSV100; irradiated rats with 2 Gy pretreated with resveratrol 10 mg 100 mg/kg body weight, respectively). C/IR are compared to C; RSV10 or RSV100 are compared to C; 2G/RSV10 or 2G/RSV100 are compared to C/IR. *p < 0.05, **p < 0.01, ***p < 0.001.

