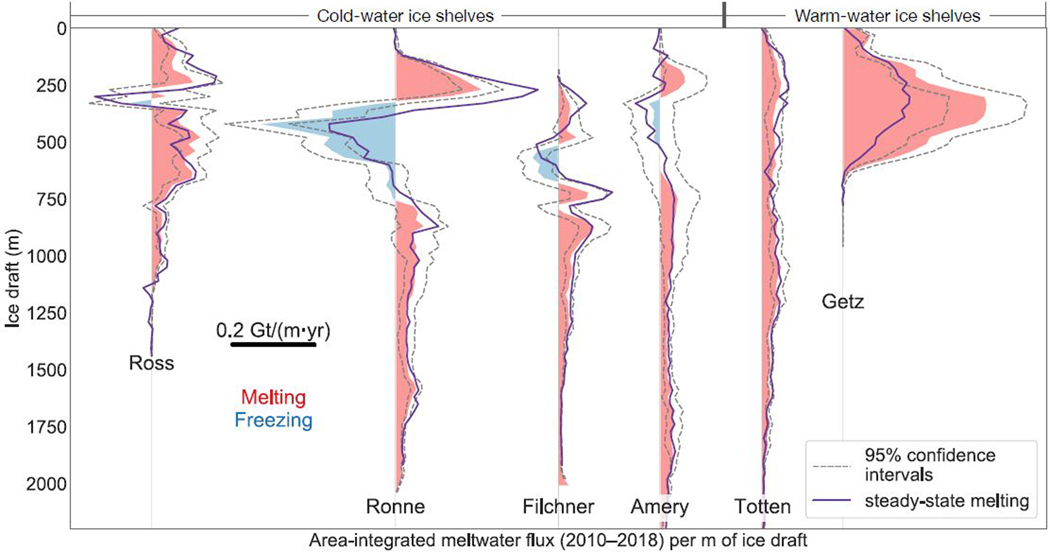
Figure 2: Vertical structure of melting and refreezing rates for selected ice shelves.
Depth-dependence of area-integrated meltwater flux (2010–2018) per m of ice shelf draft (depth of the ice shelf base below sea level) for six major ice shelves (locations shown in Figure 1). The scale for the horizontal axis is shown by the solid black line within the figure. The shaded regions in red and blue represent the mean values, and the dashed lines represent 95% confidence intervals. The purple lines are hypothetical steady-state meltwater fluxes (i.e., the meltwater fluxes required to maintain constant ice shelf mass). Warm-water ice shelves are distinguished from cold-water ice shelves by their higher average rates of meltwater production driven by intrusions of warm Circumpolar Deep Water (CDW) or modified CDW into the ice shelf cavity.

