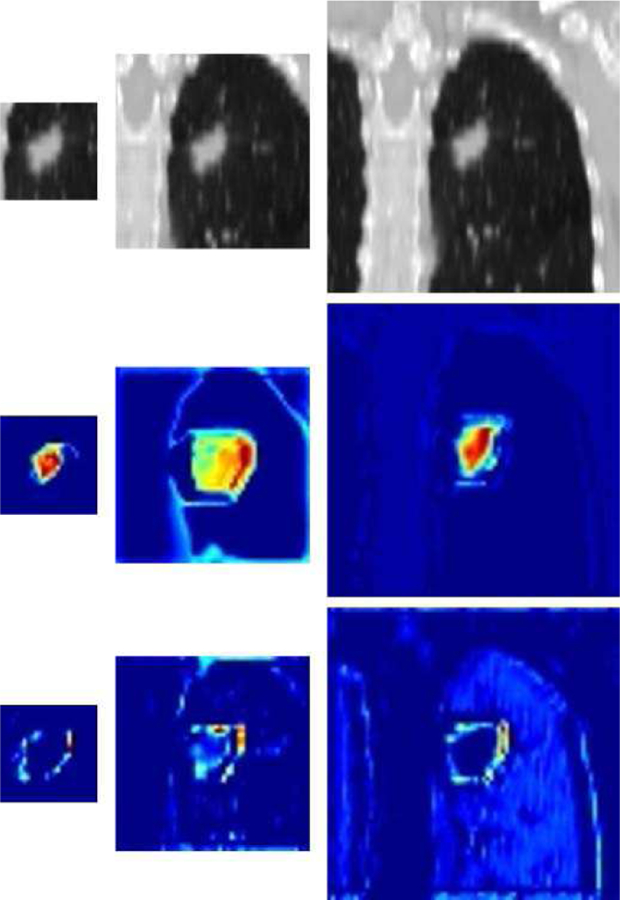
Fig. 2.

Examples of feature maps extracted from the output of 2D CNNs at the end of the first stage: original CT images (top) and their feature maps of CNN trained from scratch (middle) or fine-tuned (bottom). The left, middle, and right panels correspond to the small, middle, and large input sizes, respectively.
