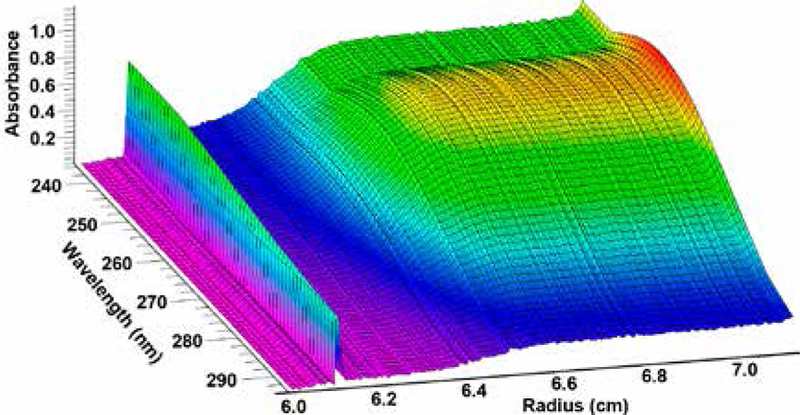
Figure 3.

A single scan from a 3D multi-wavelength experiment. Each wavelength mapped on the y-axis represents a separate boundary typically observed in a traditional single-wavelength experiment. Each radial position, mapped on the x-axis, provides a complete wavelength scan of the species sedimenting at that radial position. At approximately 6.1 cm the meniscus of the solution column is visible. The absorbance of this surface is mapped to the z-axis.
