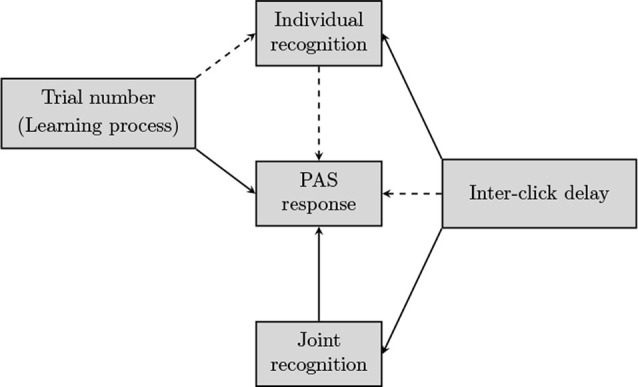
Figure 2.

Relations among observed variables at the level of the team (joint recognition, inter-click delay), trial (trial number), and individual participant [individual recognition, Perceptual Awareness Scale (PAS) response], as modeled in the statistical analysis. Dotted arrows indicate that for those relations no direct effect was found.
