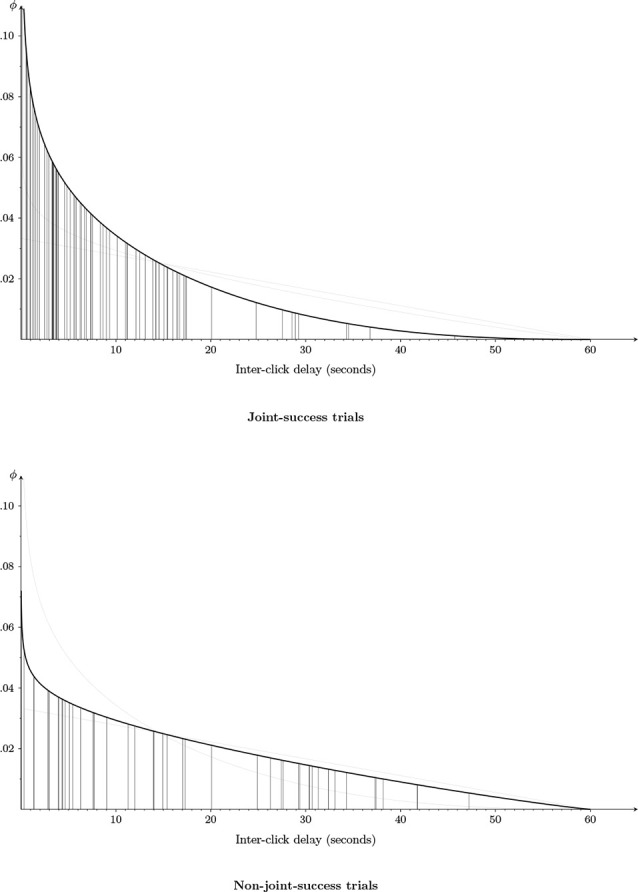
Figure 3.

Estimated distribution of inter-click delays for joint-success trials and non-joint-success trials (i.e., where either one or both players produced a click that did not correctly identify the other). The null hypothesis (based on independent uniform distributions of both players’ clicks) is represented by a thin gray line. We graphed the estimated density function separately for both conditions: joint-success trials (upper figure) and non-joint-success trials (lower figure). To allow a better comparison, we show (by a thin gray curve) the estimated density function of the other condition in both figures. Furthermore, the vertical lines connecting the density with the abscissa represent the observed values (79 inter-click intervals for joint success; 48 for non-joint success). Shorter inter-click intervals are more likely than longer intervals. Importantly, comparing joint-success to non-joint-success trials, inter-click intervals tend to be even shorter, with for example the estimated probability that an interval is below 3 s being equal to 0.25 and 0.14, respectively.
