
Figure 4.
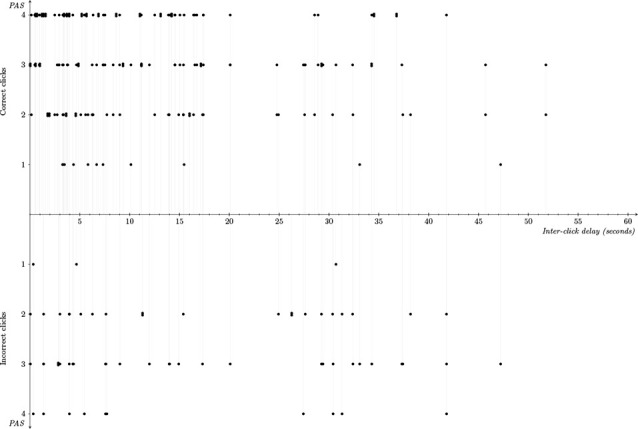
Graphical representation of the relationship between individuals’ responses. Responses were associated with the PAS, individuals’ correctly recognizing the other player (i.e., correct or incorrect click), and the dyads’ inter-click delay in trials where both members of the dyad produced a click. The thin vertical gray lines connect both responses in a dyad that correspond to the same trial and projects the corresponding points to the horizontal axis to show the corresponding inter-click delay.